
It's difficult to spot warning signs in a loan when you're reviewing a portfolio of 20+ projects per day.
Lenders use the Built platform to manage their portfolio of hundreds of contruction loans. Each loan is set up as an individual project contains a wide array of data - financials, draw history, project info, builder/borrower info, inspector info, funding source info, etc. It’s a lot of information.
For lender admins working through 20+ projects per day, it’s very easy to become confused while constantly switching contexts and lose track of the progress of each project. There is so much data and info to track within each project, it can become overwhelming and tedious to look through each tab and page of the project to check on important data points.
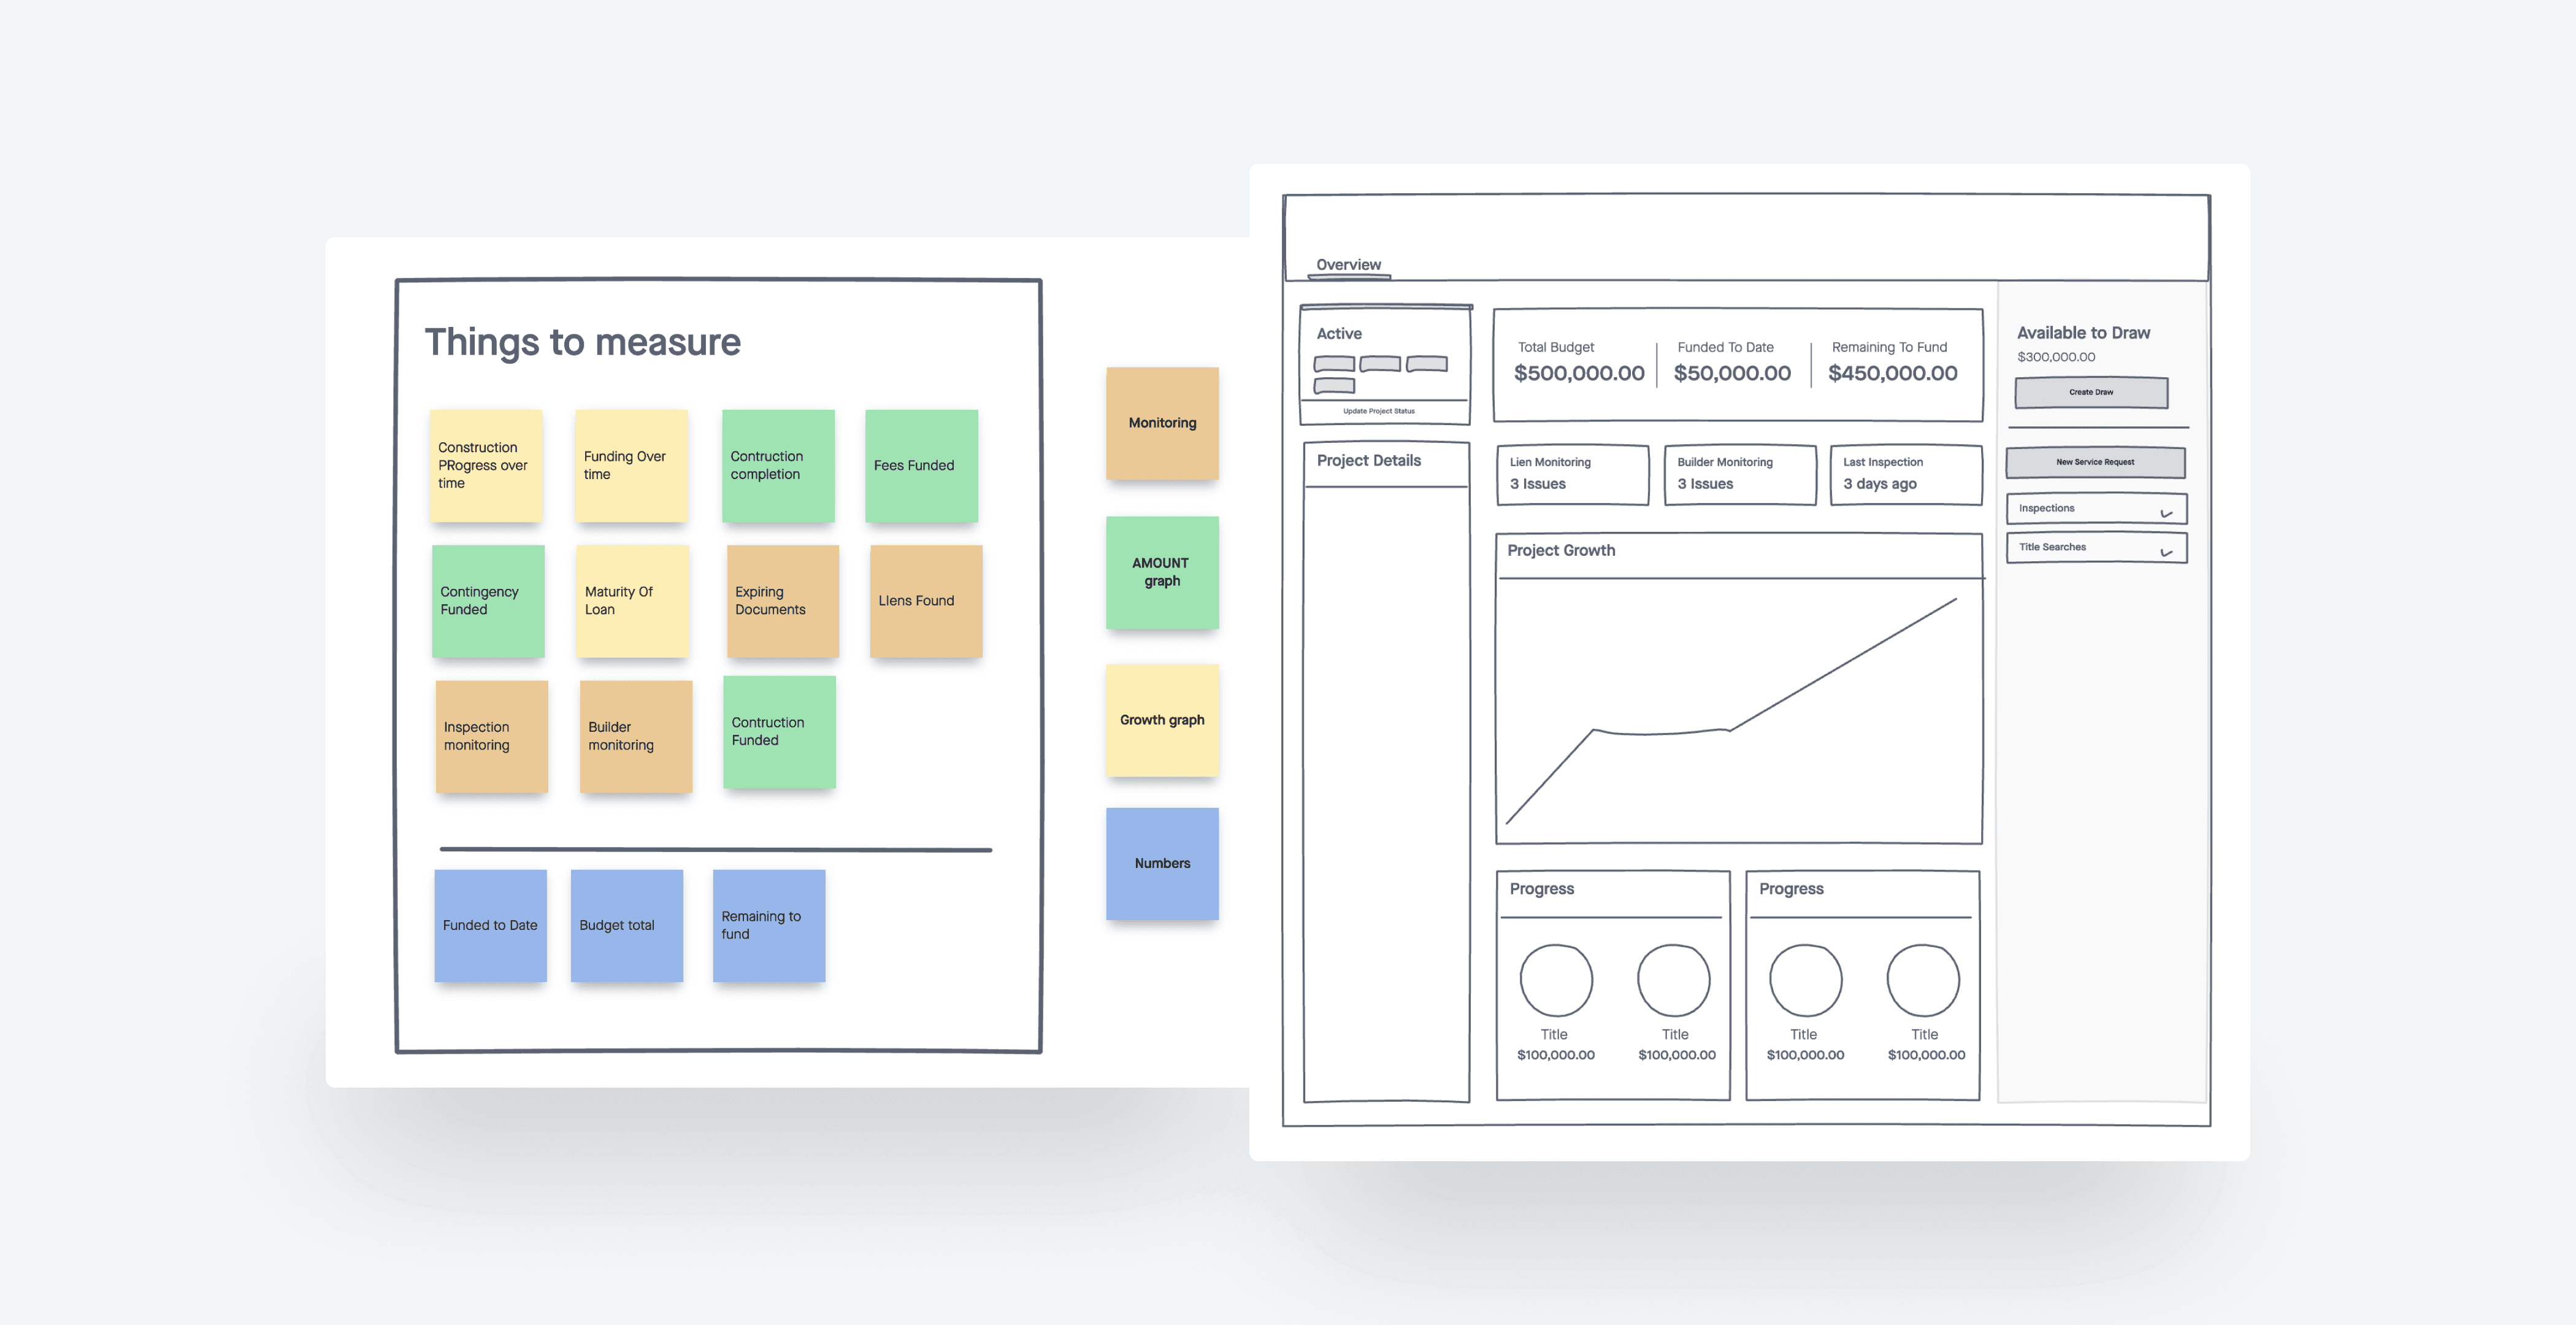
As a product team, we wanted to provide a “project snapshot” as a landing page, that would also work as a space to introduce new premium project tracking functionality to sell to our customers.
Ongoing customer feedback identified the need
We did a lot of continuous discovery at Built with recurring customer calls, and as a result, had a lot of documented feedback that is not necessarily attached to a particular initiative.
We were able to leverage this and begin this project with a lot of background knowledge about how lenders interact with projects, what information they are looking for when making decisions, and what would potentially make sense to bubble up as important info to see on first look at a project.
Discovery painted a clear picture in our mind about the value a dashboard could add.
Each project has a projected end date for construction, and lenders want to stay on schedule to maintain a healthy risk profile. They want to see their projects completed and completed on time - an unfinished building is worthless collateral to them.
Three factors for determining success
We learned through discovery that there are three variables that lenders pay attention to: time elapsed, overall construction progress, and money being funded over time. Progress and money funding should be happening at the same pace as project maturation over time.
This led me to create the “project tracker,” a remarkably simple, but powerful line graph that measured these three variables against each other in a scannable, easy to digest manner. This would be the centerpiece of our new project dashboard that we would build around.
Real time warnings through integration
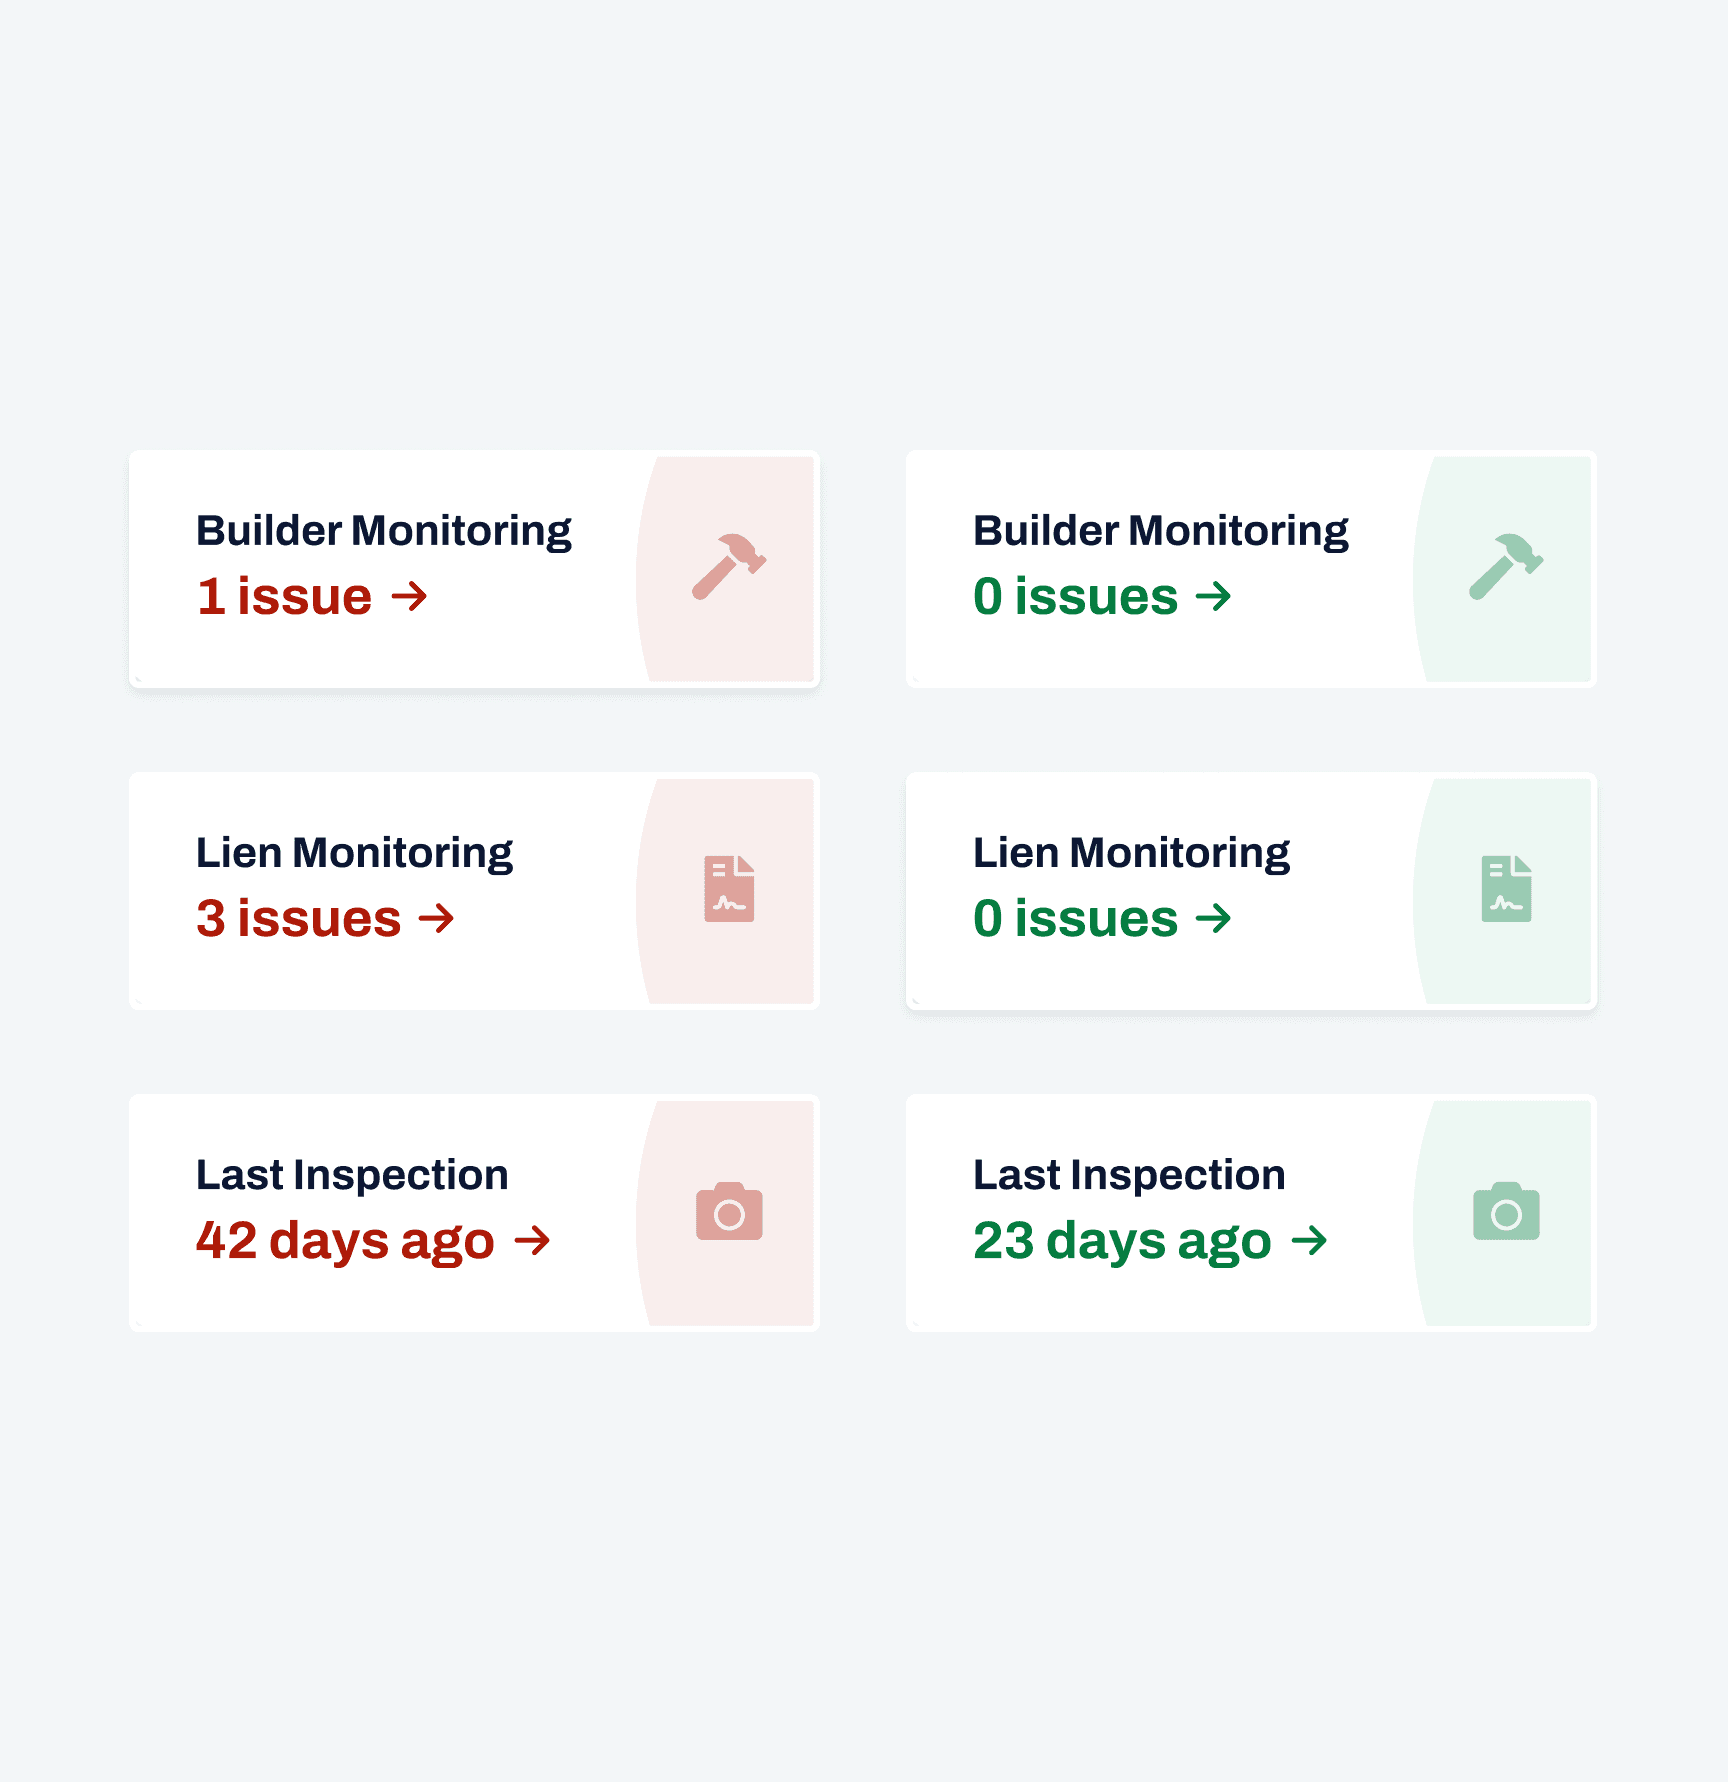
Discovery also told us that a legal problem with a builder, a lien filed on the property, and 90+ days passing without an inspection were indicators that something was going off the rails with a loan and needed investigation.
We were able to set up integrations with Experian to monitor the credit and licensure of builders, as well as DataTree to monitor the lien records of each property. This allowed us to present a live feed of any background issues uncovered for builders or property records on a project.
This gave us another powerful, premium set of tracking information to display on our dashboard to provide explicit value in real-time for the admins.


Speed to market was imperative and we wanted to validate immediately.
Our goal was to move fast on this project and get it to market.
I mocked up a Figma prototype that included our new features along with other existing project elements that we knew were important and helpful, but buried a bit in the current product.
We had a show and tell with 10 lending managers from different banks to guage the validity of the design and determine if this was something they would pay extra to use.
Business and customer value was immediately recognized
The feedback was unanimous: “I wish I had this right now.

Through iterations we uncovered more information that was helpful in a "home base" context.
Continuous testing and feedback revealed the true value of this dashboard was seeing each of the elements together in the same context.
More data points found within the project also necessitated a bird's eye view.
We found that the inclusion of things like service request statuses, reference to the last draw, expiring files, and recent comments were all helpful pieces of information in isolation, but being able to view them in a one page context was super valuable and time-saving for the admins digging through these loans on a daily basis.

Our dashboard was a financial success and became a primary selling point of the product.
The dashboard was able to provide real value to real users by taking highlights of each project page, and placing them within one “snapshot” page for contextual viewing.
One large customer was able to identify an issue that threatened to derail a $45,000 home renovation loan by reviewing the warning indicators on the dashboard.
Business value added
The sales team was immediately able to begin selling the dashboard as an upgrade to existing customers, and using it a primary selling point for new customers coming on to the platform, with the dashboard ultimately providing value to customers and the business.
Customer quote
"I was so happy that I knew what was happening in the project and that everything would be done in a timely manner."